CarComplaints.com: What The FAQ?
The most commonly asked questions.
What do your graphs mean & where is your data from?
Most of our graphs have two sets of bars — large tire tread bars with large numbers, & smaller flat grey bars.
The large bars are our data — people who have reported their car problems by filling our our Add Complaint Form. CarComplaints.com has 35 million people visit the site each year1, so our data is a fair representation of the real world.
The small grey bars are data from the NHTSA, which is the US government organization that handles safety defects & recalls. The NHTSA accepts consumer complaints about all types of problems, but they don't do anything with complaint data unless it's a safety defect. They also don't organize their complaint data by complaint groups. We've matched their confusing set of complaint categories up with ours, so their data is a lot more useful.
The numbers on the graphs show how many complaints there are on file car owners.
For suggestions about how to use this data accurately, see the sections below about complaint totals & also why we don't factor in vehicle sales/production data.
1 Keep in mind that out of the 35 million, only a small fraction take the time to fill out the form to send in their car complaints.
What are the CarComplaints.com vehicle seals & how are they evaluated?
Our rating seals are assigned to vehicles mostly depending on the score (see below). The process isn't automatic — someone notices or nominates a certain vehicle or model generation, & then it goes through our manual review process. Have one you'd like to suggest? Drop us a line & let us know.


- Seal of Awesome
- Has no apparent defects, serious or otherwise.
- Seal of Pretty Good
- May have minor defects but nothing serious (dangerous or costly).
- Beware of the Clunker
- Has significant defects but does not deserve the "Plague" rating: either the defects occur at high mileage, they don't cost a fortune to repair, or they aren't widespread.
- Avoid Like The Plague
- Has serious widespread defects that occur at relatively low mileage, cost a fortune, or may be dangerous.
About our PainRank™ scoring system
Our scores are derived from relative complaint analysis, repair cost, mileage at failure, vehicle age & other similar factors. For the relative complaint analysis, we evaluate complaints relative to what else has been reported for the same vehicle using statistical analysis. This method gives us very accurate scores, & does not require vehicle sales data. This is the same analysis method that the NHTSA & other automotive safety organizations have used very sucessfully for several decades to identify vehicle defect trends.
Can I use simple complaint totals to compare different vehicles?

Yes & no. It's an indirect method — first compare the complaint totals relative to anything else reported for the same vehicle. Then compare that relationship with other vehicles.
Say there are 100 transmission complaints for a vehicle, but the complaint totals for most other categories are 5-15 complaints each (so ~10 average). So transmission defects are being reported ~10 times above normal. With that, you can do a comparison against other vehicles.
Don't compare straight complaint totals across different vehicles unless you know what you're doing. The exception is usually you can compare one model year-to-year using straight complaint totals, because annual sales figures typically don't change very significantly. That's not always true, but the really bad model years tend to stand out regardless of fluctuations in sales.
However comparing total complaints across different makes/models will probably get you nowhere, except maybe an "F" for poor logic2. But hey, play with fire if you want to.
2 Unless you know the sales figures for each model, then you've got a flying chance for a "B+". See "Why don't you factor in vehicle sales/production data?" below.
The complaint totals are accurate & useful when you look at what the graphs are showing you, per vehicle. What stands out as defective, compared to the other categories for that same vehicle? That's easy to figure out. Then go forth & compare that relationship to other vehicles. When you evaluate one vehicle at a time, vehicle sales figures don't matter.
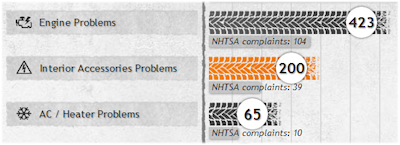
Here's an example —
| 2007 Honda Accord | 2007 Hyundai Elantra | 2007 Toyota Camry |
|---|---|---|
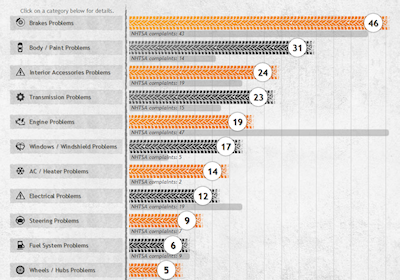 |
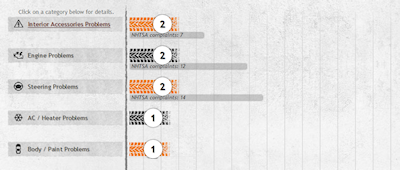 |
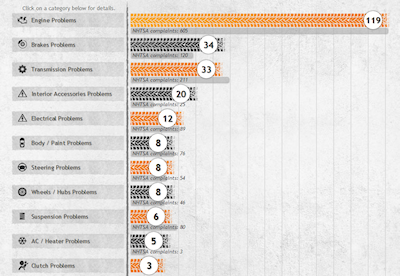 |
| The Accord has some categories with more complaints than others, but nothing hugely defective. You'd probably want to click on the bars near the top to find out how serious those brakes, body/paint etc problems are. Also the NHTSA data shows engine complaints as one of the problem areas, but again, nothing really stands out as a massive problem. | The Elantra is squeaky clean with no real defect trends showing up (in our data, anyway). Does it matter how many Elantra's were sold relative to the Camry or Accord? Nope. Nothing stands out as being a problem. The 2007 Elantra is a pretty safe bet for a good solid trouble-free vehicle. | The Camry clearly has major engine problems, with 12 times the engine complaints than the average. The Camry also shows some less-common issues with brakes, transmissions & possibly interior accessories. Does it matter how many Camry's were sold? Nope. Regardless of sales figures, engine complaints are clearly off the chart & that's what matters. |
Why don't you factor in vehicle sales/production data?
We'd love to, but apparently no one has this data. We have looked for a source for this, for years. We've asked data companies & industry professionals. So far, no one has it available. GoodCarBadCar.net is close but doesn't quite have enough historical data for all models to be useful at this point.
Also, using model sales would introduce an unnecessary margin of error. Certain vehicles may not last as long as others, so the complaint rates change over time. There's no way to quantify or adjust for that. Our commonly accepted method of relative vehicle analysis is simpler & more accurate.
Bueller? Bueller? ... Bueller?
Any other questions, ask away. Keep in mind this is a free service, but we'll do our best to get back to you.